
SVXY
//@version=5
indicator("SVXY Swing Trading with MACD (6,19,5)", overlay=true)
// MACD Settings
fastLength = 6
slowLength = 19
signalLength = 5
// Calculate MACD and Signal Line
= ta.macd(close, fastLength, slowLength, signalLength)
// MACD Histogram
macdHist = macdLine - signalLine
// 50 EMA
ema50 = ta.ema(close, 50)
// Buy and Sell Conditions
buyCondition = ta.crossover(macdLine, signalLine) and close > ema50
sellCondition = ta.crossunder(macdLine, signalLine) or close < ema50
// Plot Buy and Sell Signals
plotshape(series=buyCondition, location=location.belowbar, color=color.green, style=shape.labelup, title="Buy Signal", text="BUY")
plotshape(series=sellCondition, location=location.abovebar, color=color.red, style=shape.labeldown, title="Sell Signal", text="SELL")
// Plot MACD and Signal Lines
plot(macdLine, color=color.blue, title="MACD Line")
plot(signalLine, color=color.red, title="Signal Line")
// Plot Histogram
plot(macdHist, color=color.purple, title="MACD Histogram", style=plot.style_histogram)
// Plot 50 EMA
plot(ema50, color=color.orange, title="50 EMA")
// Alerts
alertcondition(buyCondition, title="Buy Signal", message="MACD crossover and price above 50 EMA - Buy SVXY!")
alertcondition(sellCondition, title="Sell Signal", message="MACD crossunder or price below 50 EMA - Sell SVXY!")
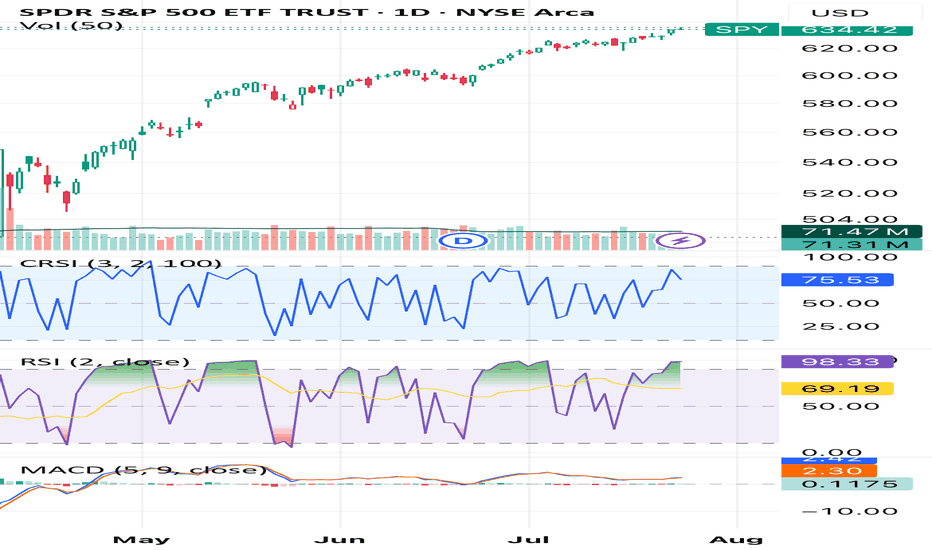
source https://www.tradingview.com/chart/SPY/O8QeVOZx-SVXY/
No comments:
Post a Comment