
SNGP in long run
SUI NORTHERN GAS PIPELINES LTD PSX_DLY:SNGP
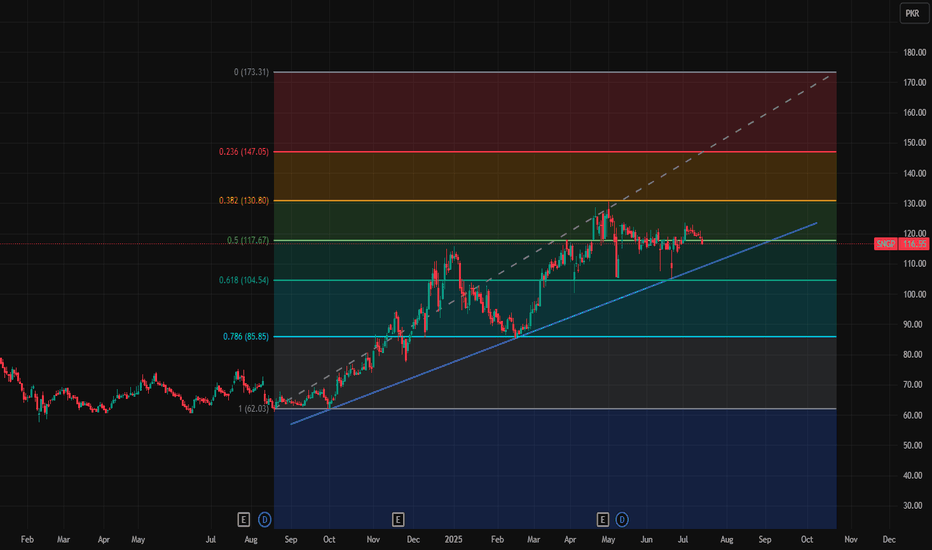
This is SNGP daily chart and blue trend line shows its positive movement and it is maintaining sustainable growth.
These are key levels 117.67, 130.8, 147.05 and 173.31
Note: This is not a buy/sell trade call, it is an analysis.
source https://www.tradingview.com/chart/SNGP/fDPTw8lz-SNGP-in-long-run/
No comments:
Post a Comment