
BTC Dominance – Bounce Zone & Relief Rally Incoming?
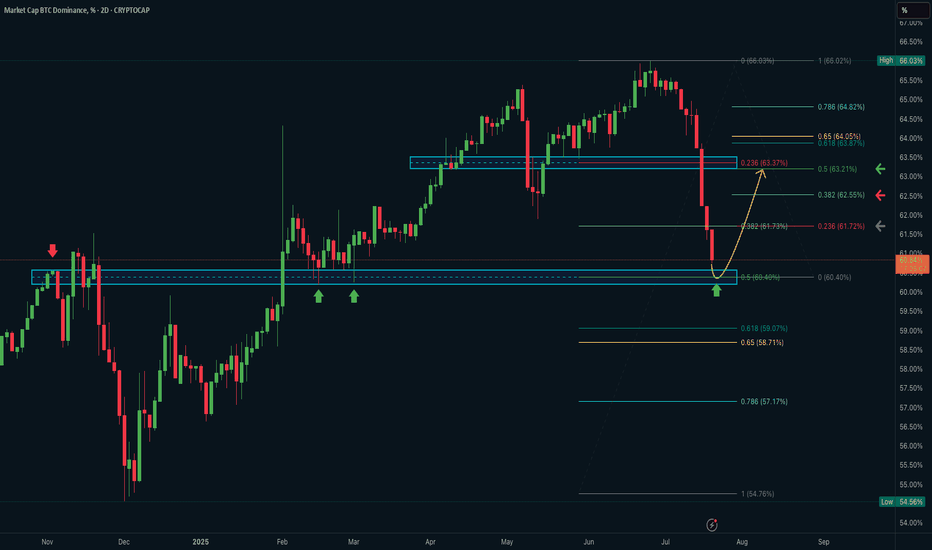
The 2 day BTC Dominance chart (BTC.D) has just tagged a multi month macro support zone between 60.4% and 60.87%, aligning with both Fibonacci and horizontal levels - signaling the potential start of a short term relief bounce.
Technical Highlights:
• Price has dropped sharply from the recent 66% high, retracing over 7% in dominance.
• The drop has reaching strong confluence support:
• Horizontal demand zone tested 4 times in late 2023 and Feb 2024 ( marked by red/green arrows)
• 0.5 Fib retracement of the November–July rally
• Local structure match from Jan–Feb consolidation
• The yellow projection suggests a likely short-term rebound toward:
61.72% (0.236 Fib)
62.55% (0.382 Fib)
63.21% (0.5 Fib)
64.05%–64.82% (resistance cluster from May–June)
What to Watch:
• If dominance holds this level → expect BTC to regain relative strength short term
• Breakdown below 60.4% would confirm major structural weakness and trigger altseason acceleration 🍏
Macro Takeaway:
• BTC.D is reaching one of the most reactive zones of the last 12 months.
• This reaction will influence whether the broader market enters a BTC led recovery or continues the altcoin dominance surge.
source https://www.tradingview.com/chart/BTC.D/YDtnCtCK-BTC-Dominance-Bounce-Zone-Relief-Rally-Incoming/
No comments:
Post a Comment